Houseplant soil moisture monitoring systemIntroductionI like to build electronics based on MicroPython devices. I started out working with the PyBoard v1.1, and have dabbled with the PyBoard D a little bit, but I have mostly jumped over to boards built around the ESP8266 chip, and occasionally the ESP32 chip. While I am enamored with the ESP-01S module, I tend to gravitate to the D1 Mini the most of all, which itself contains an ESP-12F module (which contains an ESP8266 chip). The amazing thing about the ESP chips, unlike the older version of the PyBoard, is that they include built-in WIFI, which makes them immediately prospective edge devices, aka the Internet of Things (IoT). 
One rather successful project was an exit/entry detector on the cat door to my catio. The device used an IMU attached to the swinging door (the IMU is not shown in the photo) to detect when the door was pushed from its closed vertical position up to one of its two open horizontal positions (inward or outward). These events were then wirelessly transmitted to my desktop computer, elsewhere in the house, as http GET requests, where the computer, running a web server, would receive these event transmissions and log them for subsequent data analysis. This system ran for slightly over one year from late May 2020 to early June 2021 before eventually failing for unknown reasons. During that time, the system logged over 6800 exit/entry events, which comes out to eighteen exit/entry pairs per day, or nine trips out to the catio per day. The IMU (an MPU9250) was mounted on the outside of the catdoor, which exposed it to exterior temperatures (albeit protected from rain), so its eventual failure is not too surprising. Another project I wanted to build for a long time was a moisture monitor for my many, many, MANY houseplants. I dabbled with components of this system for quite a while and eventually built a prototype in late 2022, which I rapidly expanded all over my house. The data-handling model is designed closely after the catio door model, with moisture readings being wirelessly transmitted to my deskop via http, but this time I extended the web server to publish a regularly updated web report of the state of the numerous plants under observation. Soil moisture sensors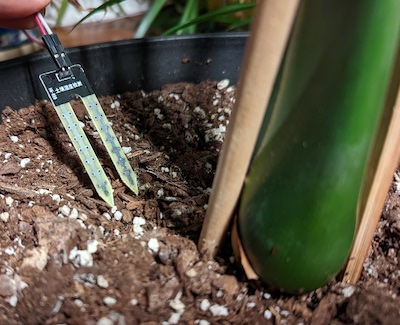
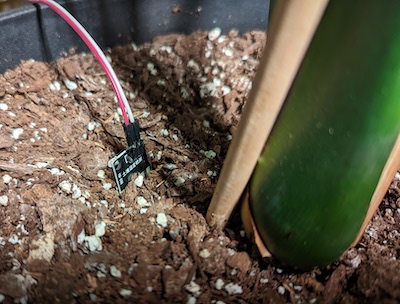
The soil moisture sensors are resistive sensors (there are also capacitive soil moisture sensors available), which house two separated pieces of metal. They detect the electrical resistance of a circuit passing through the soil in direct contact with the sensor, obviously with wetter soil imparting lower resistance. This resistance alters the circuit's voltage, which the D1 Mini/ESP-12F/ESP8266 senses on an input pin and converts via an analog-digiital-converter (A/D) to a digital integer, i.e., data. This data value is then transmitted wirelessly to the desktop web server for archiving and analytics. Multisensor aggregation and WIFI transmission station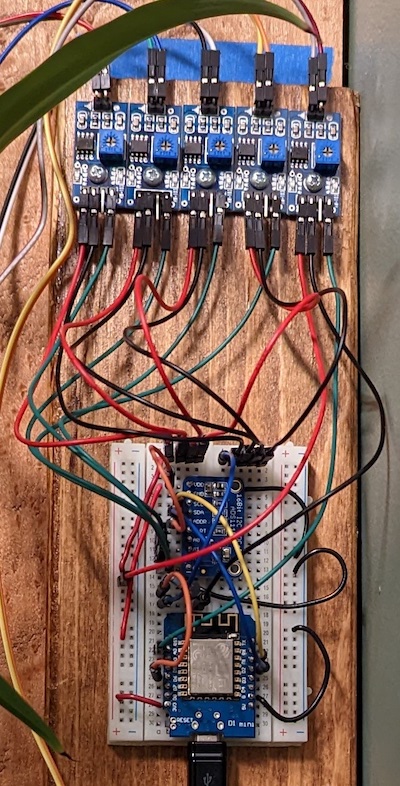
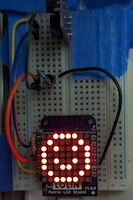
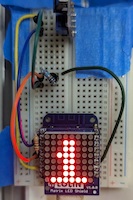
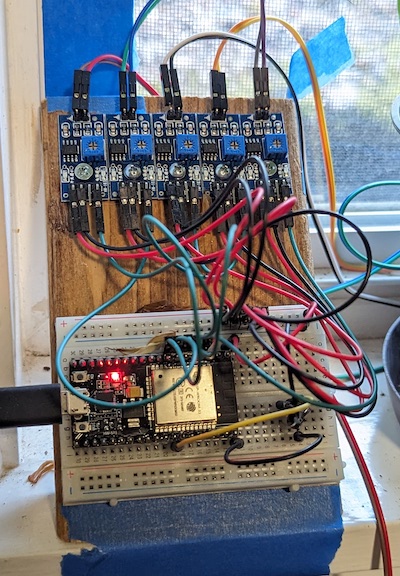
Here is how a single station is set up. The blue D1 Mini is at the bottom of the picture, housing a black ESP-12F module (about half the size of the D1 Mini) that is almost entirely covered by a flat rectangular metal RF shield except for a small black section of the ESP-12F module that is visible at the top where you can see the gold WIFI antenna zig-zagging in a strange arrangement. You can also see the USB power cable connected to the bottom of the D1 Mini. Power is provided by a standard USB wall-power adapter. If the RF shield was removed, we could see the ESP8266 chip, which would be tiny a black square on the ESP-12F. Above the D1 Mini, still on the white bread board (the white plastic covered in tiny holes), there is a blue ADS1115 board, which is a 4-channel A/D converter. The D1 Mini only provides a single analog sensor pin (for reading soil moisture in this case). In order to read the soil moisture of multiple plants from a single D1 Mini station, I need to add additional analog inputs. The ADS1115 provides four such inputs. In an extended version of this project, the ADS1115 can be assigned one of four distinct I2C addresses, which would enable four ADS1115s to be connected to a single D1 Mini. In other words, a single D1 Mini could, in theory, read sixteen analog sensors from as many different plants in the vicinity of the station (or, in fact, seventeen if the D1 Mini's solitary analog pin was used as well). For this project, none of the four stations distributed around the house extend to multiple ADS1115s yet. At the top of the station, we see five soil moisture control modules. The paired wires connected to the tops of the modules lead to the soil moisture sensors inserted into the plant pots. The modules provide an analog and a digital output along their bottom edge, and provide a thresholding potentiometer (the blue cube with a Phillips head crosses inset into it) that adjusts and determines the analog value at which the digital output pin triggers. For this project, I didn't use the digital output however. I simply fed the analog voltage directly into the ADS1115 (or directly into the D1 Mini), which in turn fed A/D converted digital integer values to the D1 Mini. Since the ADS1115 only provides four inputs and we can clearly see that five modules are utilized at the top of the setup, it is obvious that this particular monitoring station is also using the D1 Mini's solitary analog input for a fifth plant. Each of the four stations in the house is configured somewhat differently in this regard. Soil moisture sensor power controlThis close-up of the lower portion shows the transistor (the black semi-circle-shaped object) situated on the bread board between the D1 Mini and the ADS1115. Resistive soil moisture sensors undergo electrolysis when powered, which rapidly degrades them. They won't last long as a result. Furthermore, powering them continuously is a waste of electricity for an application such as this one. I don't need to sense the soil moisture every continuous instant forever. I just need to sample it for a fraction of a second at some longer interval. I chose fifteen minutes as my sampling interval. To power the sensors on and off, I toggle this transistor from an output pin on the D1 Mini, which in turns supplies or denies power to the sensors. Every fifteen minutes, the D1 Mini wakes up (from its own power-saving, low-power mode, mind you) and then turns the soil moisture sensors on for a brief moment to read their values. It then turns the sensors off again, reports its data to the web server over the WIFI connection, and goes back to sleep for another fifteen minutes. StationsI currently have four stations set up around the house, with each station gathering measurements from one to five plants. OfficeThe office station monitors four plants: an arrowhead vine, a waffle plant, a weeping fig, and a kangaroo fern. 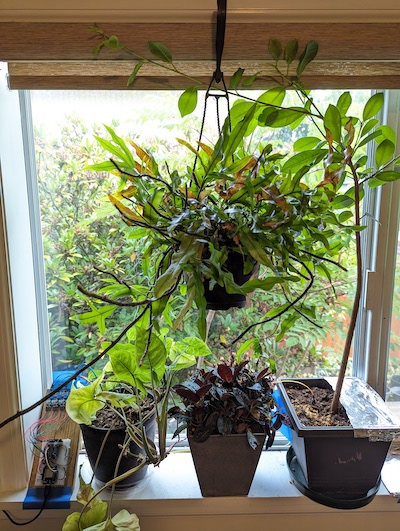
BedroomThe bedroom station monitors five plants. Originally, there were three spider plants, a silver satin, and a bird of paradise. I later moved the bird of paradise to the floor (you can see it barely poking into the photo on the left edge) and replaced it with a philodendron Goeldii. The jade plant shown in the photo is not being monitored by the system. 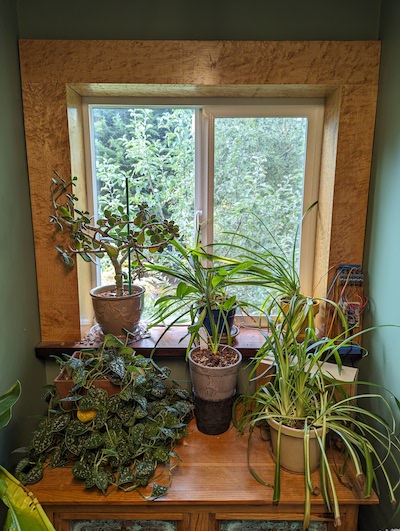
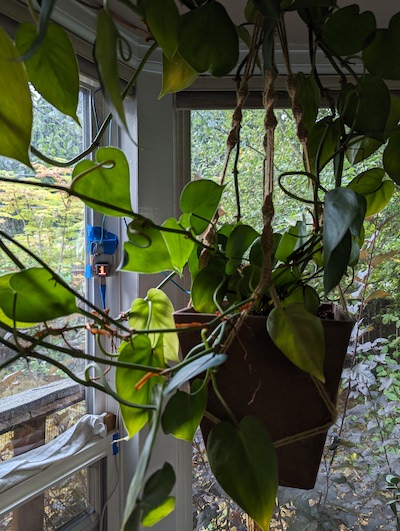
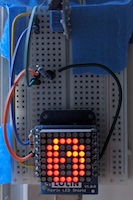
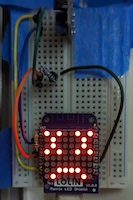
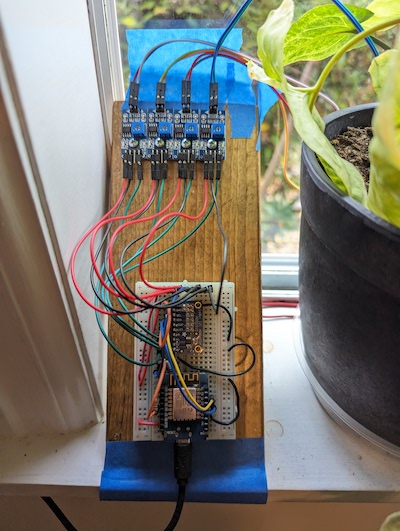
DiningThe dining room station currently only monitors a single plant, a heart-leafed philodendron, even though there are several plants in the bay window. As such, it has no need for an ADS1115. The D1 Mini offers numerous "shields" or add-on boards for various extended functionality. For this station, I experimented with an 8x8 monochrome LED display shield. You can see the station blue-taped to the window box behind the plant. The LED module enables the station to display its status on-site, without requiring me to view the web-based monitor. If the single monitored plant has more than nine expected days until watering, the display shows a smiley face. Anywhere from zero to nine expected days shows a number counting down day by day (it shows a '1' in the photo). If the plant dries out, the display shows a "dead" frowny face. The display module also supports a brightness parameter, so I scale the brightness according to the time of day. It would be nice to extend this feature to respond to ambient light using a D1 Mini ambient light sensor shield I have, but I haven't constructed or programmed that feature yet.
Living Room NI named this station 'N' because I anticipated adding a second station at the south end of the room, but I haven't done so yet. This station monitors five plants: a weeping fig, a spider plant, a swiss cheese plant, a heart-leafed philodendron Brasil, and a bird of paradise. This station doesn't use a D1 Mini. It uses an ESP32 board instead, but the principle is almost exactly the same. However, one difference is that the ESP32 provides numerous analog inputs, unlike the D1 Mini's solitary analog input, so I don't need to use an ADS1115 for this station. 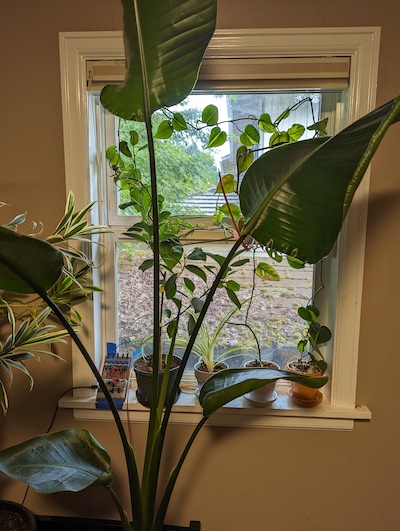
Webpage dashboard upper sectionThe web server receives sensor data from various stations around the house on a regular basis, with each station reporting every fifteen minutes. When receiving data from most of the stations, the server simply logs their new values and does nothing else. However, when one particular station reports (it doesn't really matter which one, so I arbitrarily chose the office station), the web server updates all of its analysis and then updates the reporting on a webpage that I can read from anywhere on the internet (yes, I can access it from anywhere in the world, not just from inside my house, which is marvelously useful when I'm traveling). Here is the top part of the webpage (I will go through the bottom part later). The top part shows various panels with different kinds of information: 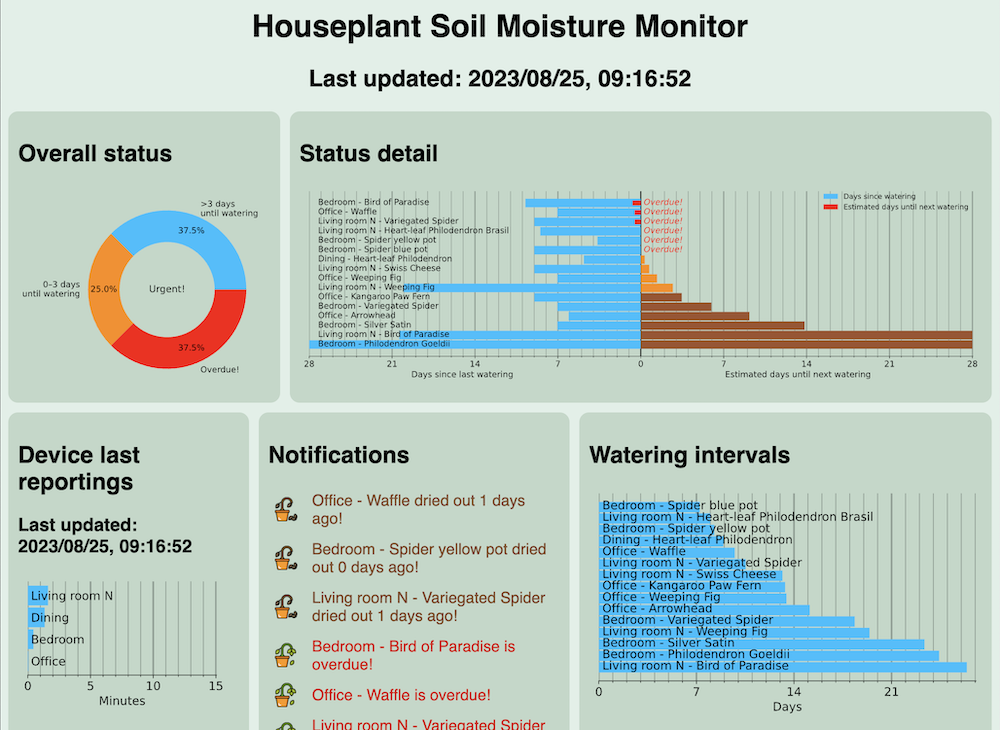
Webpage dashboard lower sectionThe webpage continues below the panels described above. The lower portion of the webpage offers detailed time-series plots of the sensor data as well as trend-line prediction plots that anticipate when plants are expected to require watering. Expected time until next wateringThe first section below the status panels shows plots of the moisture level of each plant since the time of its last watering event, along with projected trendlines that indicate how far into the future the sensor value will rise (i.e., dry-out) above the permitted threshold for that particular plant. The thresholds are adjusted on a per plant basis depending on how dry each plant likes to get before being watered. In the example shown below, we can see that the soil moisture for the variegated spider plant in the bedroom is expected to dry out beyond the blue-dotted threshold line in about two days while the silver satin plant in the bedroom is expected to dry out in nine days (according to a linear fit). 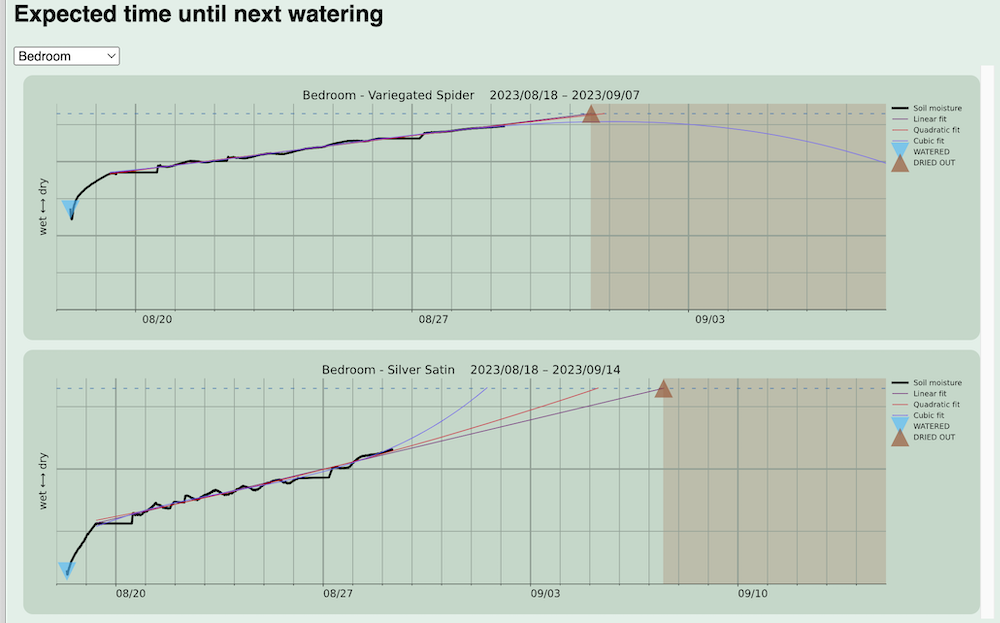
Daily, weekly, and monthly sensor plotsThe second section shows daily sensor value plots, grouped by station (i.e., grouped by room in the house), with each fifteen-minute sensor sample indicated by a dot. The plot includes markers for detected watering events and dry-out events. Note that these events are automatically detected. Watering events are inferred by sudden drops in the moisture sensor value while dry-out events are detected simply by the moisture level exceeding the permitted threshold for that particular plant. 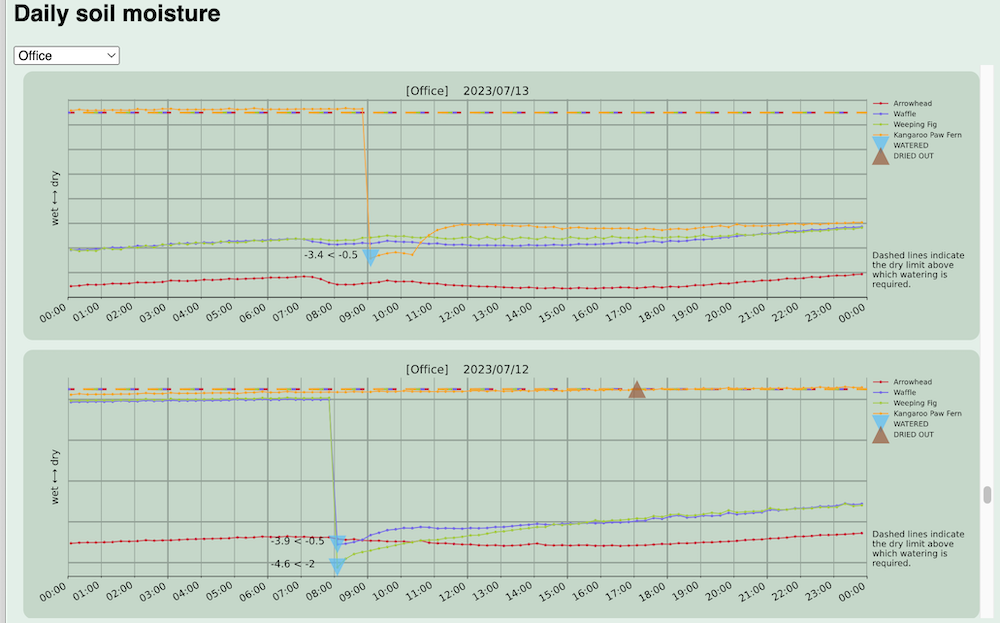
The third section shows weekly plots. Although all data points are included in the plot, they are not indicated by individual dots. 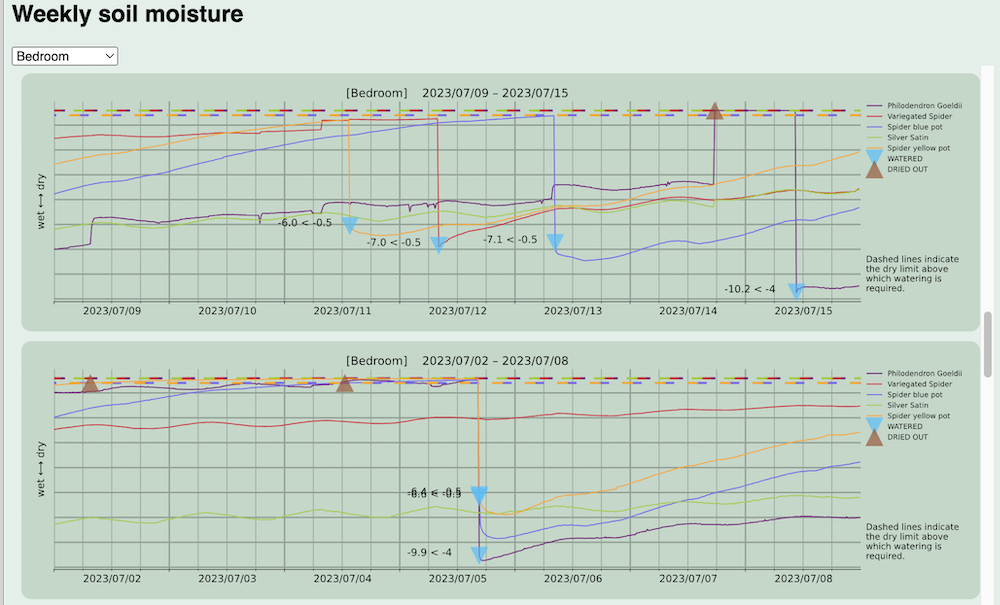
The fourth section shows monthly plots. 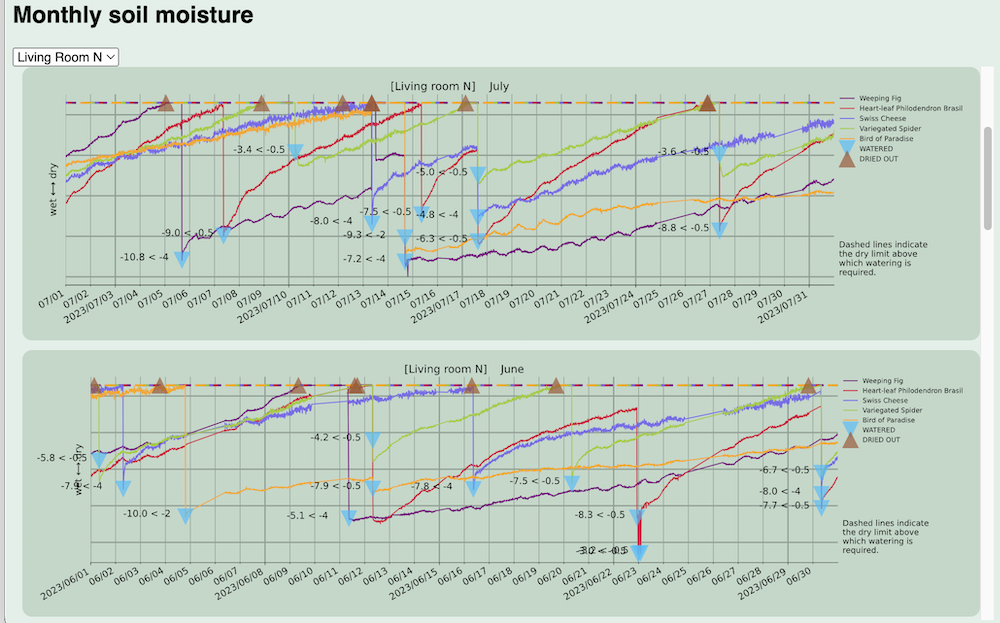
Future WorkThere are a number of features that would be nice to add in the future. Of course, I want to add additional stations to monitor more of the plants in my house. I am also somewhat enamored with making a battery-powered single-plant device that would get rid of the wires and the centralized stations, but I'm unsure about that. Although it would be tidier in some respects, it would impose continual battery recharging on a system that currently runs independently off wall power. I am also intrigued by the idea of enabling the D1 Mini's output pins to turn a watering system on and off to automatically irrigate the plants in response to their moisture levels. It might also be interesting to expand on-site status display. Currently, the single dining room plant uses a monochromatic 8x8 LED display module to show the status of that plant, as described above, but there are additional shields available for the D1 Mini, including an 8x8 RGB LED display based on NeoPixels, a tri-color e-paper module (white, black, and red), and LCD, TFT, and OLED display modules, of both monochromatic and color varieties. Any of those display options would make a nice expansion. As for the dashboard, the generality of the HTML layout could adapt better to small screens so as to specialize for display on phones (although it currently works well enough that I haven't felt the need for such development). Likewise, one could, if so inclined, develop a full-blown phone app for this dashboard instead of relying on the web browser. I used to do some pretty serious Android programming, but it's been many years since I did anything like that. On the analytics side, I would like to expand the passive data display webpage into more of an interactive dashboard of some sort. And of course, I imagine there are much more sophisticated analytics I could be performing and visualizing on the data that is being captured. At the current time, very little is done in that respect. The last panel showing the average watering intervals per plant is pretty much as far as I have taken the analytics aspect of the project. |
|||||